System · Live Diagnostics
One score for the current condition of your HIPAA program.
The Live Patient Protect Score, built from Setup (visibility), Compliance (execution), and Security (exposure). Updated in real time. Present it to auditors, board members, your team — it's always now.
HIPAA mapping
What this satisfies in the Security Rule.
3 citations, each with the specific Live Diagnostics behavior that satisfies it. The mapping is the receipt — what you can show an auditor without assembling anything new.
§164.308(a)(1)Security management process
The composite score is the visible expression of program state. Auditors evaluating the process see it at a glance.
§164.308(a)(8)Evaluation
Continuous evaluation, not periodic. The score's history demonstrates ongoing assessment.
§164.316(b)(2)Time limit (six-year retention)
Score history is retained with full granularity for the regulatory six-year window.
What it does
The number that's true now.
Compliance reporting traditionally answers “what was true at some point in the past.” Practices assemble status before audit, present it to a board, file it away. Between assemblies, no one knows the number.
Live Diagnostics flips that. The Patient Protect Score is always current — derived continuously from your SRA, your Advice queue, your workforce records, your audit log, your training completions, your BAA states. The number is what's true now. Show it to anyone, anytime.
The history is the second piece. The dashboard shows where you are now and where you've been — the practices that look strong on audit are the ones whose history shows steady improvement over months, not a heroic week before review.
How it works
5 mechanisms keep Live Diagnostics working.
One composite, many contributors.
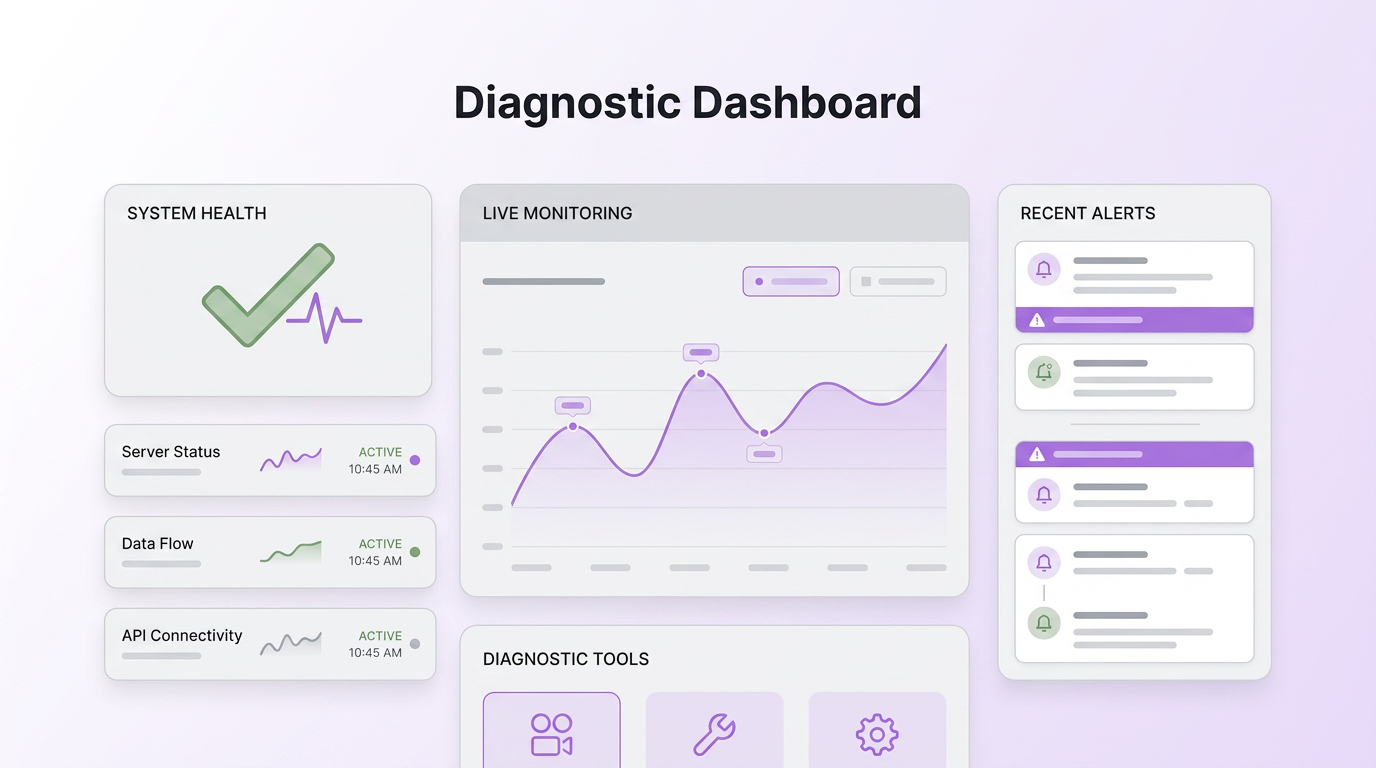
The composite score aggregates twenty modules. Each module reports its own internal completeness. The composite weights them by regulatory significance. The dashboard shows both the composite and the contributing breakdown — useful for spotting which modules are pulling the number up or down.
Real-time updates.
Every state change in any module fires an update event. The dashboard receives updates within seconds. There is no batch job, no scheduled refresh, no “as of” date that's older than this morning.
Score history with full granularity.
Every score state is retained — daily snapshots, plus event-level granularity for material changes. The history view shows trend curves over 30, 90, and 365 days. Hover a point to see what specific events drove the score state at that moment.
Category breakdown by Security Rule structure.
Beyond the per-module breakdown, the score categorizes by Security Rule structure: Administrative Safeguards (§164.308), Physical Safeguards (§164.310), Technical Safeguards (§164.312). Auditors looking at specific categories see them isolated without losing the composite.
Export for board and auditor presentation.
The dashboard exports as PDF for board packets, as CSV for analytics, and as an audit-pack that includes the score plus its history plus the underlying contributing data. Boards get the headline number; auditors get the substantiating record.
Who this is for
Built for the practices that need it most.
Practice owners and operators.
The score is the answer to “how are we doing?” without a prep meeting or a status email chain. Pull up the dashboard, see where you stand, see what changed since last week.
Compliance leadership.
The Security Officer and Privacy Officer use the score as the working surface for the program. Movements in the score surface both wins (training completion bumps) and slippage (a BAA going expired before renewal). The dashboard makes both visible.
Boards and oversight committees.
Practice boards rarely want to read 30-page compliance reports. They want the number, the trend, and the brief on what changed. The dashboard exports a board-ready packet in one click.
Auditors and consultants.
External reviewers get a current view rather than a stale snapshot. The history view substantiates that the number is the result of continuous evaluation, not assembled-before-audit bookkeeping.
Connected to
No module is an island.
Live Diagnosticsworks because it's connected. Every signal feeds another module; every closure becomes evidence somewhere else.
System layer
Risk Intelligence
Risk state contributes to the composite score; reducing risk improves the score.
Learn moreSystem layer
Autonomous Compliance Engine
Every task closure moves the score; the engine is the most active contributor.
Learn moreIntelligence layer
Audit Replay Timeline
Any score state in history can be replayed from underlying events for full audit reconstruction.
Learn moreWhat you get
5outcomes you'll feel in week one.
One number, always current.
Composite compliance score, derived from twenty modules, updated in real time.
Trend visibility.
30-day, 90-day, 365-day views of where the program is going.
Category breakdown.
Administrative, Physical, Technical — matching auditor expectations.
Event-level attribution.
Every score change traces to a specific platform event.
Board-ready and audit-ready exports.
PDF for boards, audit-pack for OCR.
What does a “good” score look like?
Is the score gameable?
Can I see what's pulling my score down?
What if I disagree with the weighting?
How does this differ from “Compliance Status: Yes/No”?
Can I share the dashboard externally?
Continue exploring
Related features in the platform.
System
Risk Intelligence
Risk recalculates the moment a gap closes. Not at quarter-end. Not when you remember to run a report. The picture is always current.
Learn moreSystem
Autonomous Compliance Engine
Auto-generates work from your SRA. Closes when conditions are met. No manual check-offs. No missed deadlines.
Learn moreIntelligence
Audit Replay Timeline
Reconstruct what happened, when, in what order, by whom. Every incident investigation, audit response, and forensic exercise — answered from timestamped evidence.
Learn moreNext step
See your Live Patient Protect Score light up in 90 minutes.
Most practices have their first Live Patient Protect Score within 90 minutes of starting. The trend line begins compounding from there. Read the full breakdown at /patient-protect-score.
No contracts. No consultants. Starting at $39/mo.