Introducing the HIPAA Breach Dashboard: A New Era of Real-Time Compliance Visibility
Track HIPAA breaches in real time with Patient Protect's breach dashboard. Live OCR data, diagnostics, and risk tools — free for all healthcare providers.
Written and reviewed by the Patient Protect team — Joseph A. Perrin, CTO (former government CTO, military-grade security architecture), Angie Perrin, CSO (Certified HIPAA Consultant, 10+ years clinical practice), and Alexander Perrin, CEO (15 years enterprise SaaS).
The Office for Civil Rights maintains a public portal listing every reported HIPAA breach affecting 500 or more individuals. The data is there. It has always been there. But "there" is a government website built for regulatory compliance, not operational intelligence.
The raw HHS breach data is difficult to search, impossible to visualize, and disconnected from the context that makes it useful. You can see that a breach occurred. You cannot easily see what it means for your practice.
We built the HIPAA Breach Dashboard to change that.
What the Dashboard Shows
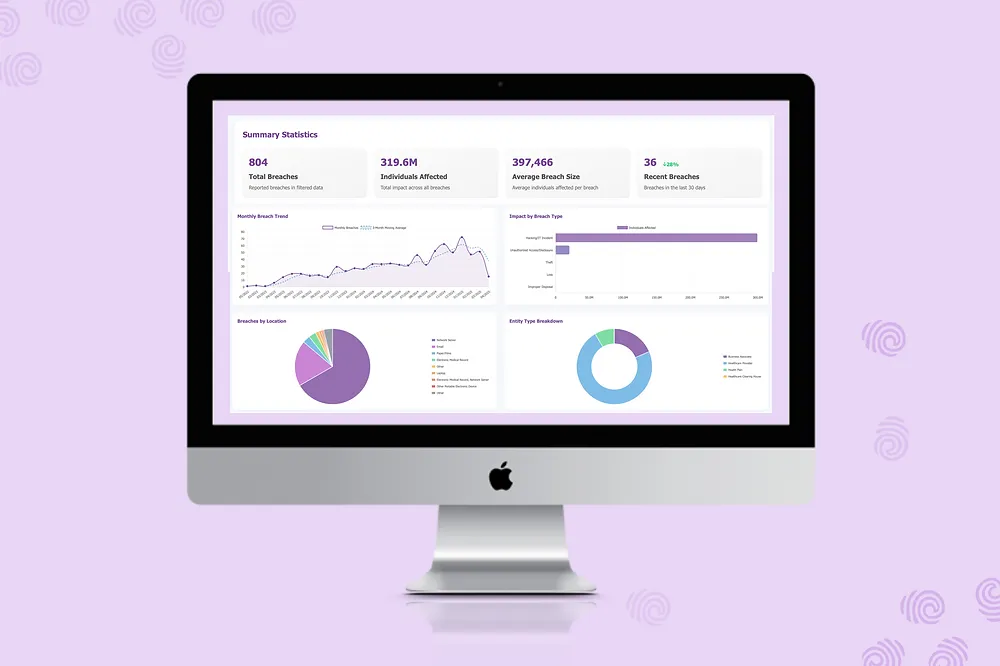
The breach dashboard transforms raw HHS OCR data into actionable intelligence for healthcare providers. It is available for free — no account required, no paywall, no restrictions.
Live Breach Data
Every breach reported to HHS OCR is captured and displayed in real time. Each entry includes the covered entity name, state, breach type, individuals affected, date reported, and the nature of the breach (hacking/IT incident, unauthorized access, theft, loss, improper disposal). The data is searchable, sortable, and filterable by any field.
This is not a static report. The dashboard updates as new breaches are reported to HHS. When a covered entity in your state reports a breach, you can see it within hours of the public filing.
Geographic Risk Mapping
A state-level choropleth map visualizes breach concentration across the country. Darker states have experienced more reported breaches. This view lets you instantly assess the breach density in your region and identify whether your state is experiencing elevated threat activity.
Geographic context matters. Breach patterns are not uniform. Some states experience disproportionate breach activity due to population density, threat actor targeting patterns, or regulatory enforcement intensity. The map makes these patterns visible at a glance.
Trend Analysis
The dashboard tracks breach volume, affected individuals, and breach type distribution over time. These trend lines reveal whether the threat landscape is improving, deteriorating, or shifting in ways that require attention.
In 2024, 276 million Americans had health data exposed. Attacks on independent providers rose six-fold since 2021. The Change Healthcare breach alone affected more than 190 million patients. Trend analysis puts these numbers in temporal context — showing not just how bad it is, but how fast it is getting worse.
Severity Scoring
Not all breaches are equal. A breach affecting 501 patients through unauthorized employee access has different operational implications than a breach affecting 5 million patients through a ransomware attack on a clearinghouse. The dashboard applies severity scoring to help providers prioritize their attention.
Critical breaches — those involving large populations, active cyber campaigns, or systemic vendor failures — are surfaced with elevated prominence. Routine small-scale breaches are available but do not dominate the view.
Why Visibility Matters
Most independent healthcare practices operate in a state of informed helplessness when it comes to the breach landscape. They know breaches happen. They read about the big ones in the news. But they have no systematic way to assess whether the threats they are reading about are relevant to their practice type, their region, or their vendor ecosystem.
This gap has consequences.
Underestimated risk. Without visibility into breach frequency and severity, practice owners systematically underestimate their exposure. The true cost of a violation is far worse than most providers realize because they have never seen the data presented in a way that makes it personal.
Delayed response. When a business associate is breached, affected covered entities are often the last to know. The dashboard provides a monitoring mechanism — check whether your vendors have appeared in the HHS data before OCR contacts you.
Compliance documentation gaps. HIPAA requires that covered entities maintain awareness of the threat environment. A risk assessment that does not reference current breach trends is incomplete. The dashboard provides the evidentiary basis for threat-aware risk management.
Insufficient security investment. Practice owners who cannot see the threat landscape tend to defer security spending. The dashboard makes the case visually: breaches are not rare events affecting other people. They are daily occurrences in healthcare, and independent providers are increasingly in the crosshairs.
How to Use the Dashboard
Monitor Your State
Check your state's breach activity regularly. If breach reports in your state are increasing, your practice faces elevated risk — especially if the breaches involve practice types or vendors similar to yours.
Watch for Your Vendors
Search the dashboard for your business associates — EHR vendors, billing services, clearinghouses, IT contractors, cloud storage providers. If a vendor you share ePHI with appears in the breach data, you may have notification obligations and should engage your incident response plan immediately. Make sure you have mapped all your vendor relationships with our ePHI data flow mapper.
Benchmark Your Risk
Use the dashboard's trend data to contextualize your own risk assessment findings. If your risk assessment identifies gaps in access controls, and the dashboard shows that unauthorized access breaches are trending upward in your state, that gap moves from theoretical to urgent.
Inform Your Team
Share relevant breach data with your workforce during security awareness sessions. Real examples from the dashboard are more effective training material than abstract policy language. When staff can see that a practice similar to theirs was breached last week for the same kind of mistake they might make, the training becomes concrete.
Support Insurance Discussions
Cyber insurance carriers increasingly require evidence that practices maintain awareness of the threat environment. Dashboard exports and trend summaries provide documentation that your practice actively monitors breach activity — strengthening your underwriting profile.
What the Dashboard Tells Us Right Now
The current data paints an unambiguous picture. Healthcare remains the most breached industry in the United States. The average breach costs $9.8 million. Medical records command $280 to $310 per record on the dark market — ten times the value of credit card data. And the attack volume targeting independent providers is accelerating.
For small practices, the financial impact of a breach — regulatory fines, litigation costs, patient attrition, and remediation expenses — can exceed the practice's annual revenue. The dashboard exists to make that risk visible before it becomes a reality.
Free for Everyone
The breach dashboard is free for all healthcare providers. No Patient Protect account required. No feature restrictions. No data limitations.
We built it free because breach visibility should not be gated behind an enterprise subscription. Every dental office, behavioral health clinic, chiropractic practice, and physical therapy center in the country deserves access to the same threat intelligence that hospital systems take for granted.
Visit the breach dashboard now. Explore the data. Search your state. Search your vendors. And if what you find concerns you — which it should — take the next step with a free risk assessment to understand your specific exposure.
For daily curated intelligence on enforcement actions, regulatory changes, and cybersecurity threats, follow HIPAA Pulse. For mobile breach alerts and compliance tools, download the Patient Protect Signal app.